Miftah Fahmi
Sep 00,00:00 PM
Book a Call
AetherFi0 / 15
100%

AetherFi

Year

2024

Client

AetherFi

Service

Pitch Deck

Stage

Series A

Year

2024

Client

AetherFi

Service

Pitch Deck

Stage

Series A

I designed a 15-slide Series A pitch deck for AetherFi, a self-directed DeFi concept for cross-chain liquidity. The presentation connects transaction friction with a proposed product mechanism and commercial plan. Metrics, projections, partnerships, patent references, regulatory status, and investment terms are illustrative design content.
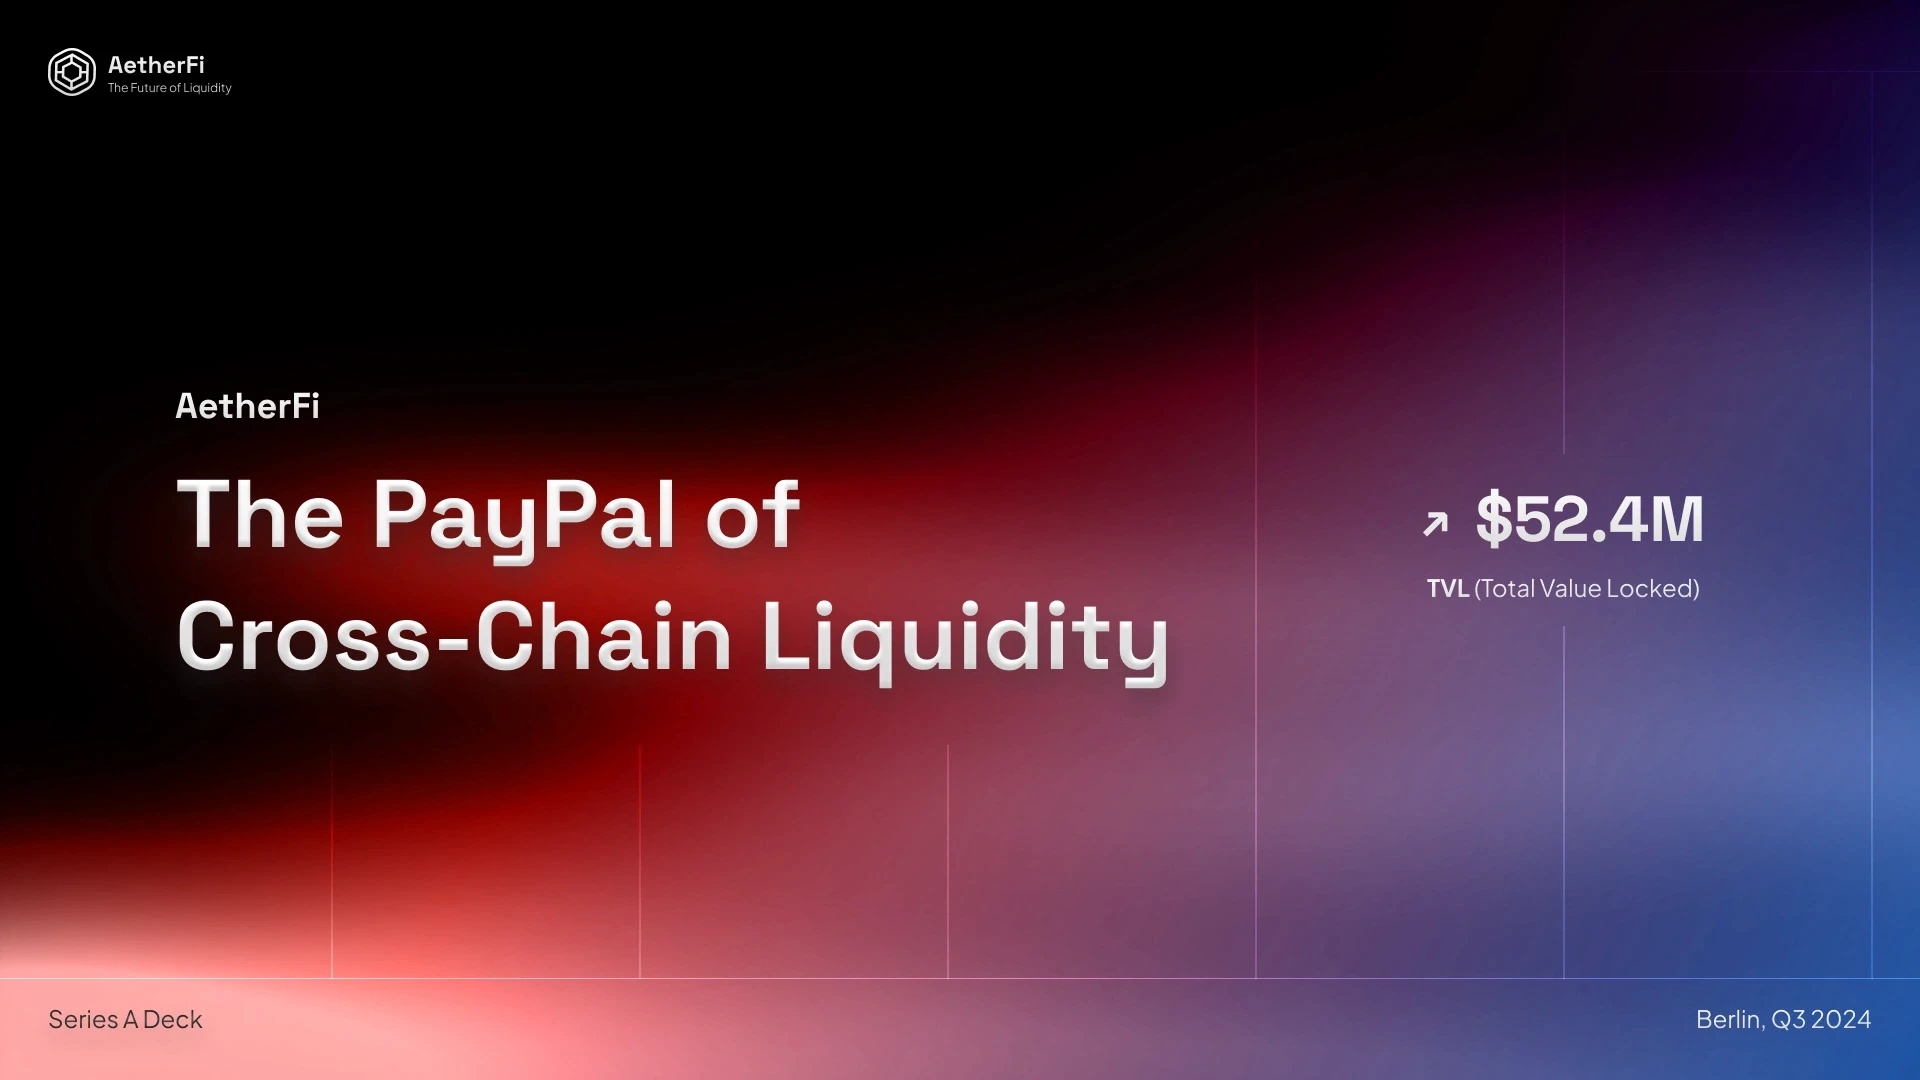
AetherFi cover slide
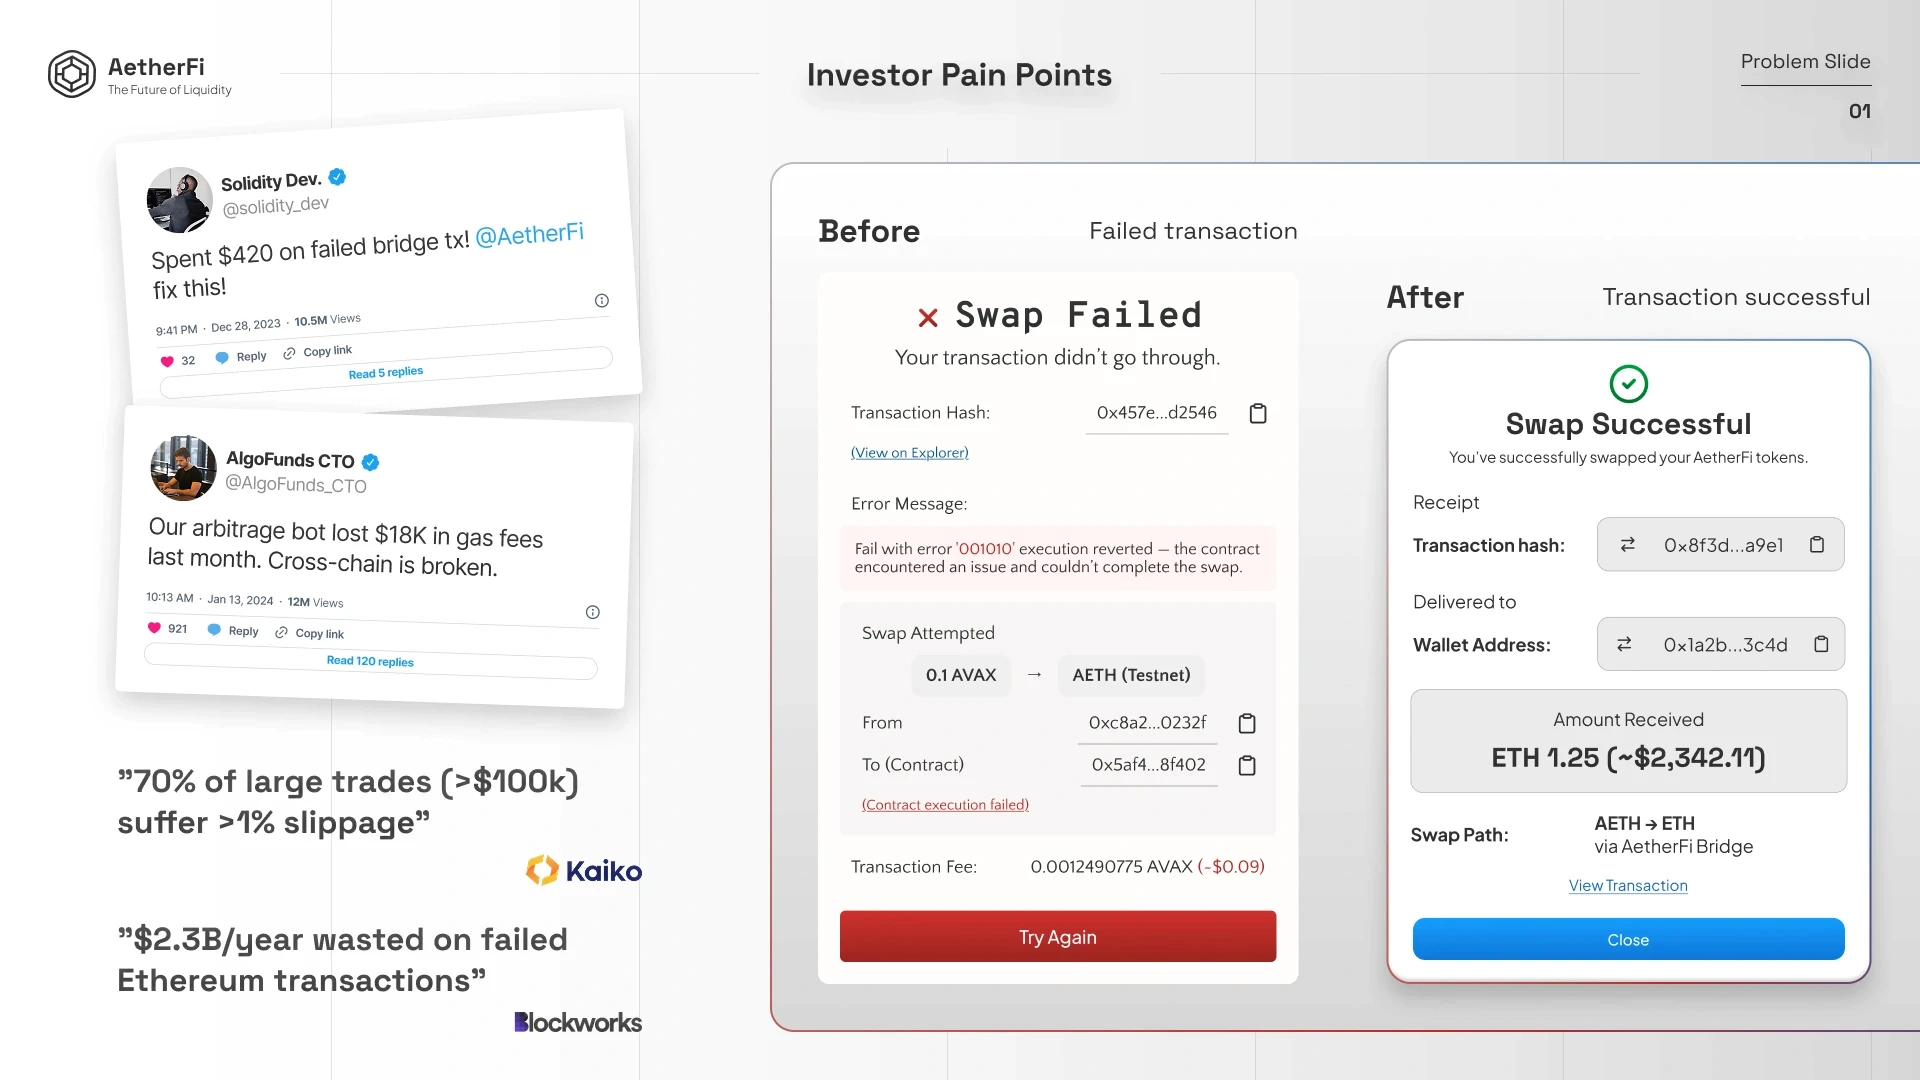
AetherFi failed swap and successful swap comparison illustrating cross-chain transaction friction.
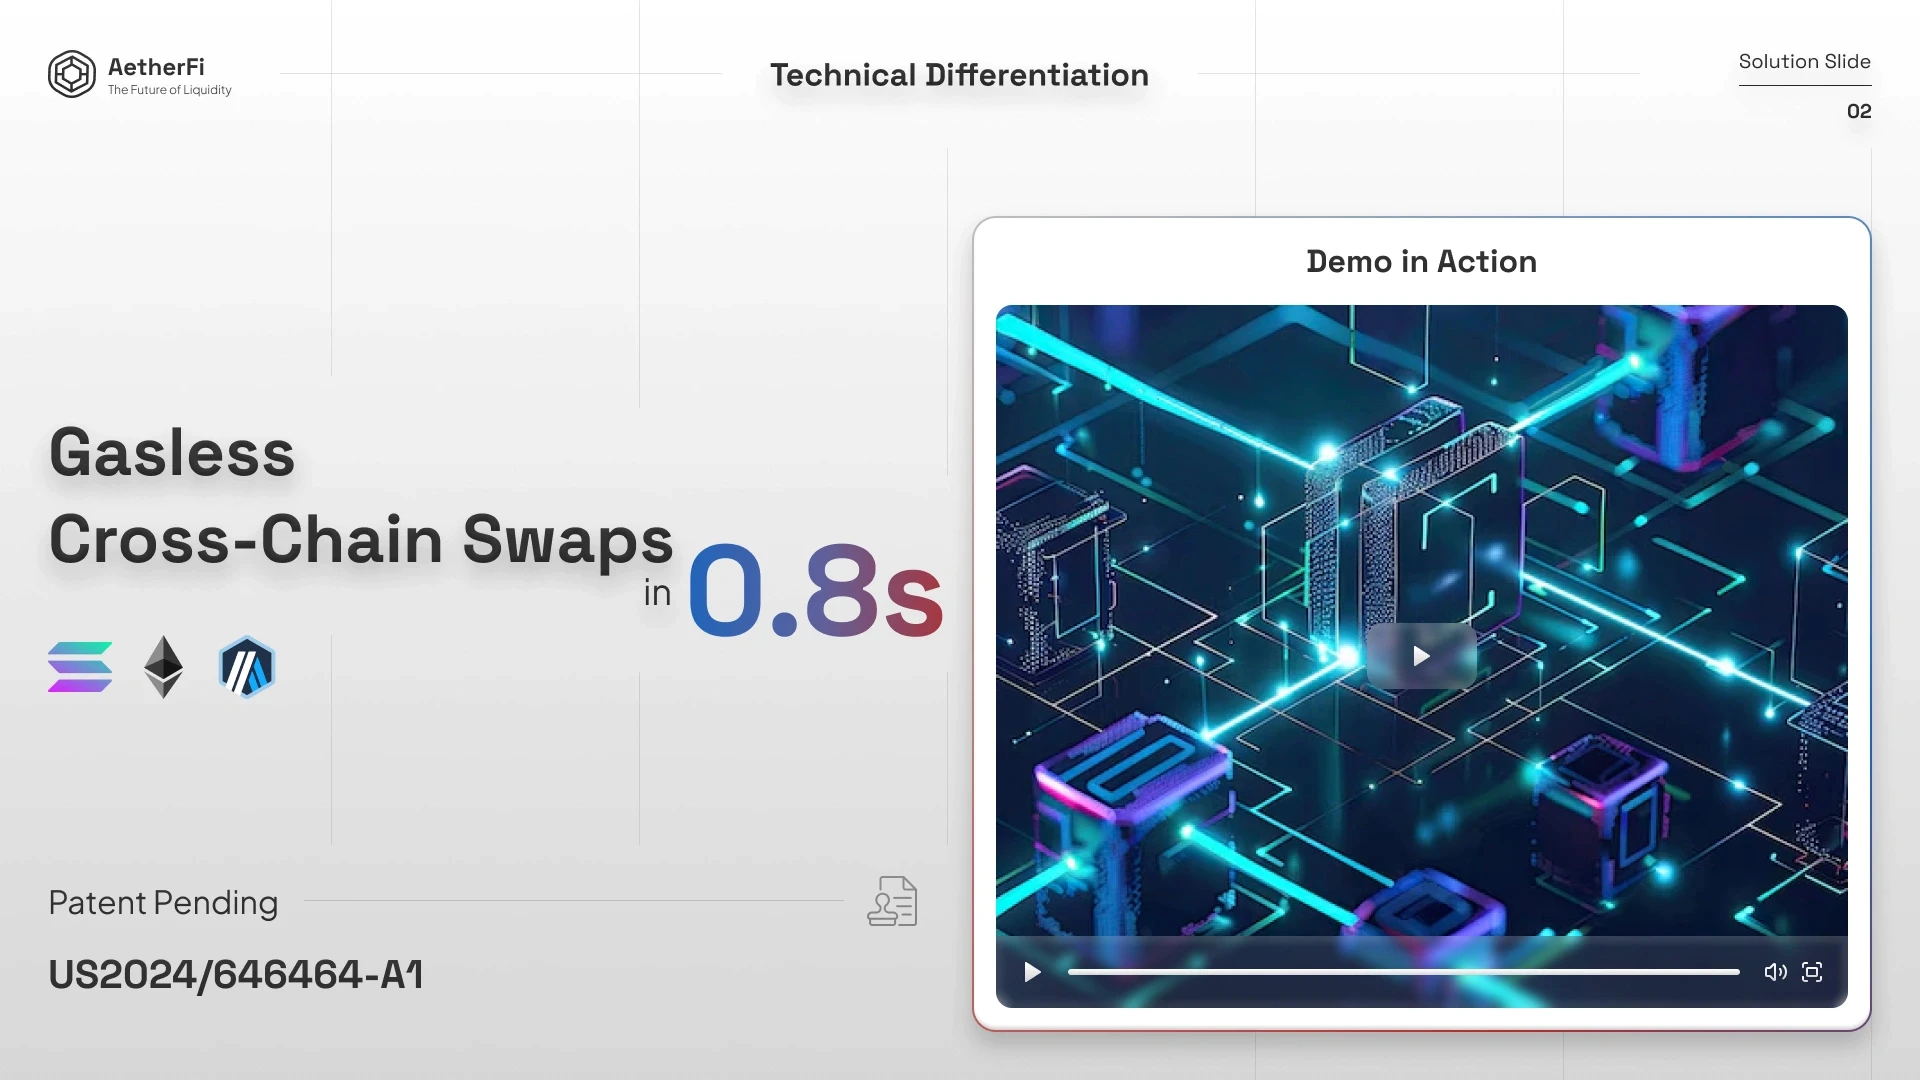
AetherFi gasless cross-chain swap mechanism and product demonstration.
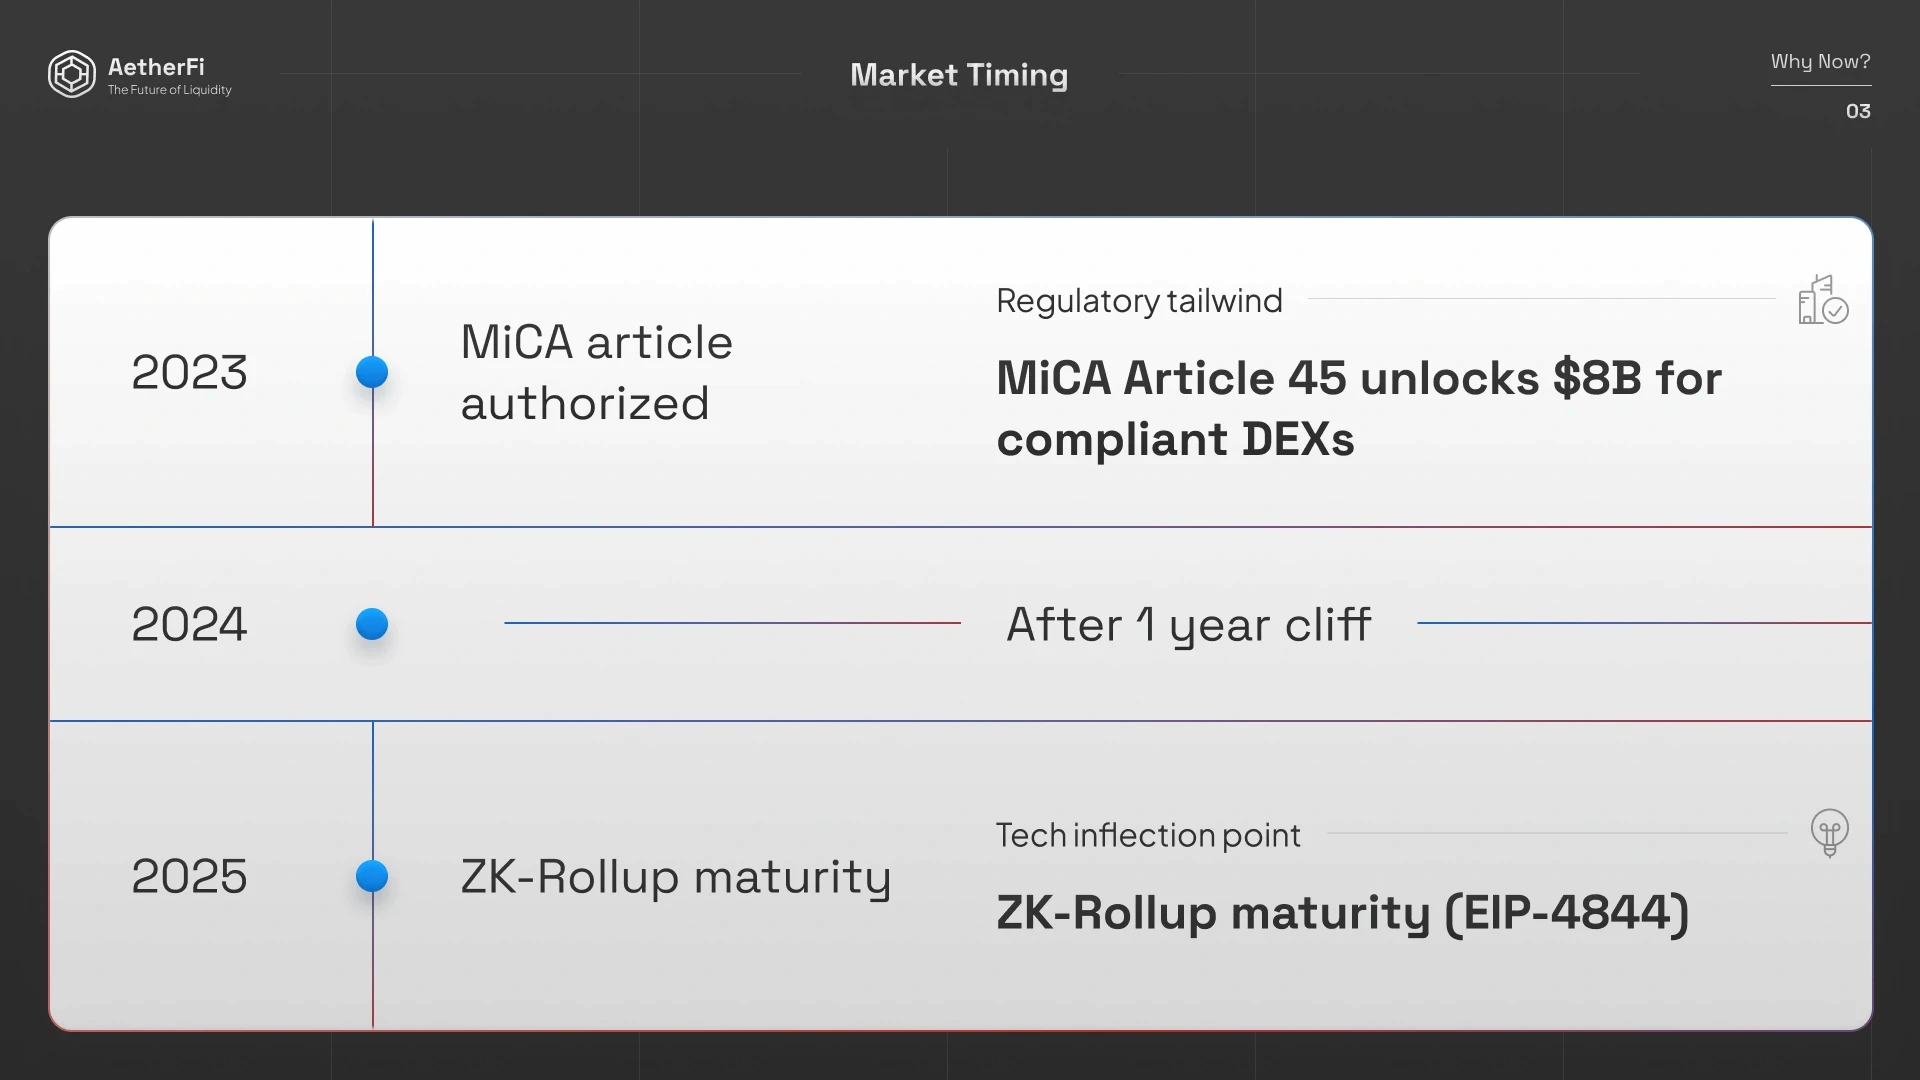
AetherFi market timing timeline covering regulation and scaling technology.
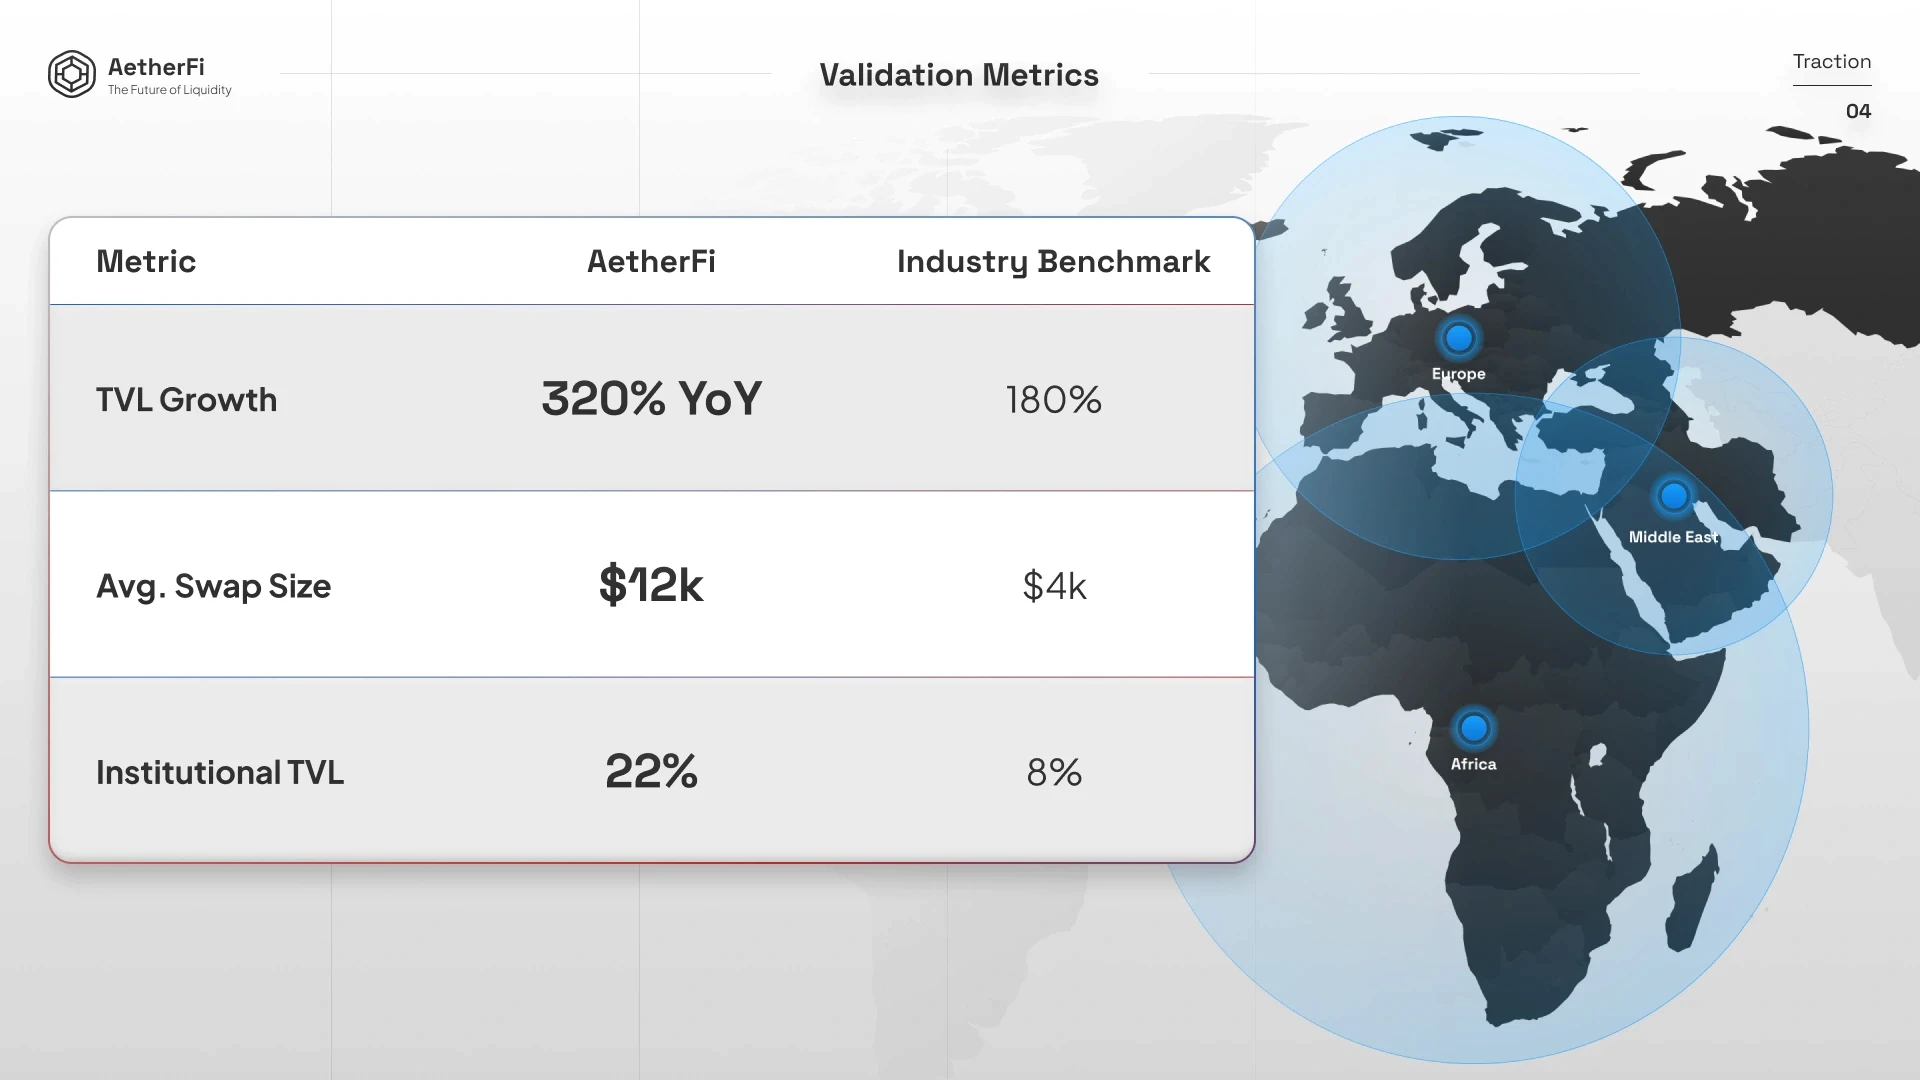
AetherFi validation metrics comparing liquidity growth, swap size, and institutional participation.
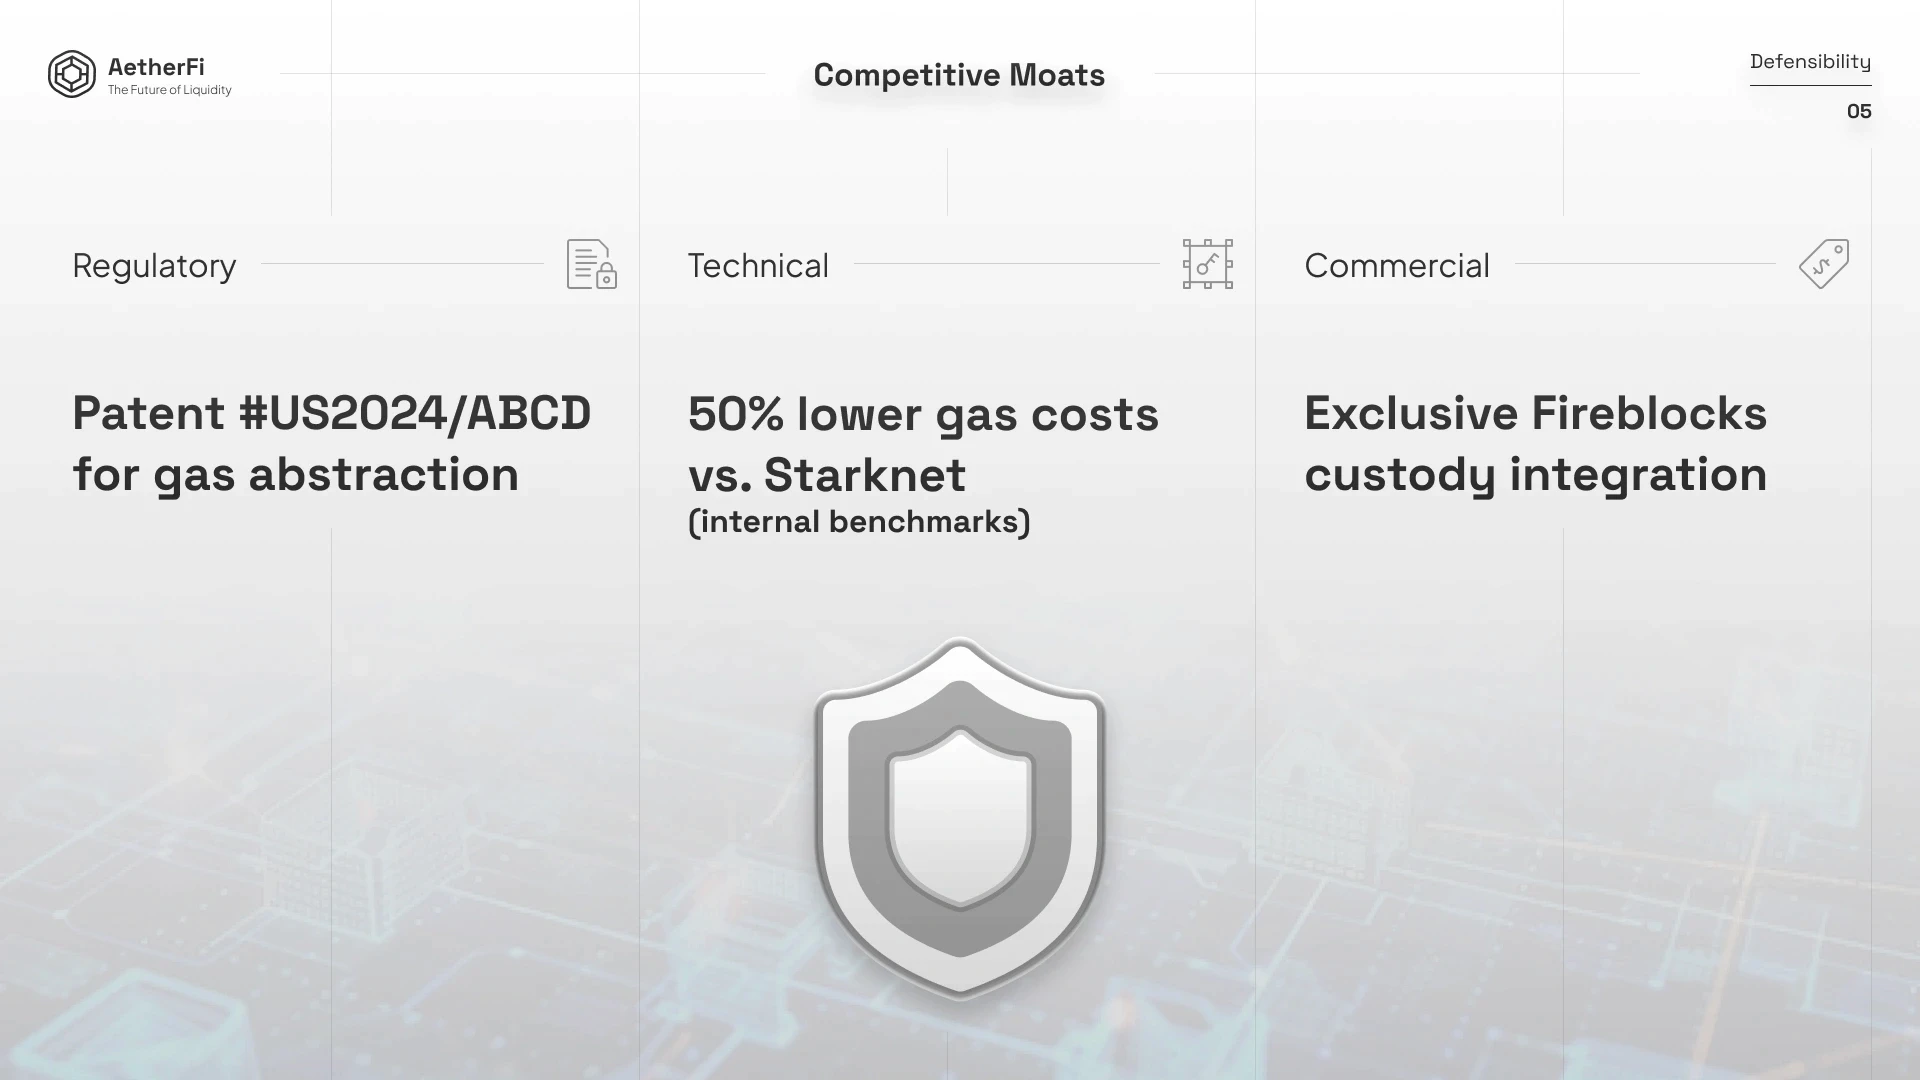
AetherFi proposed regulatory, technical, and commercial defenses.
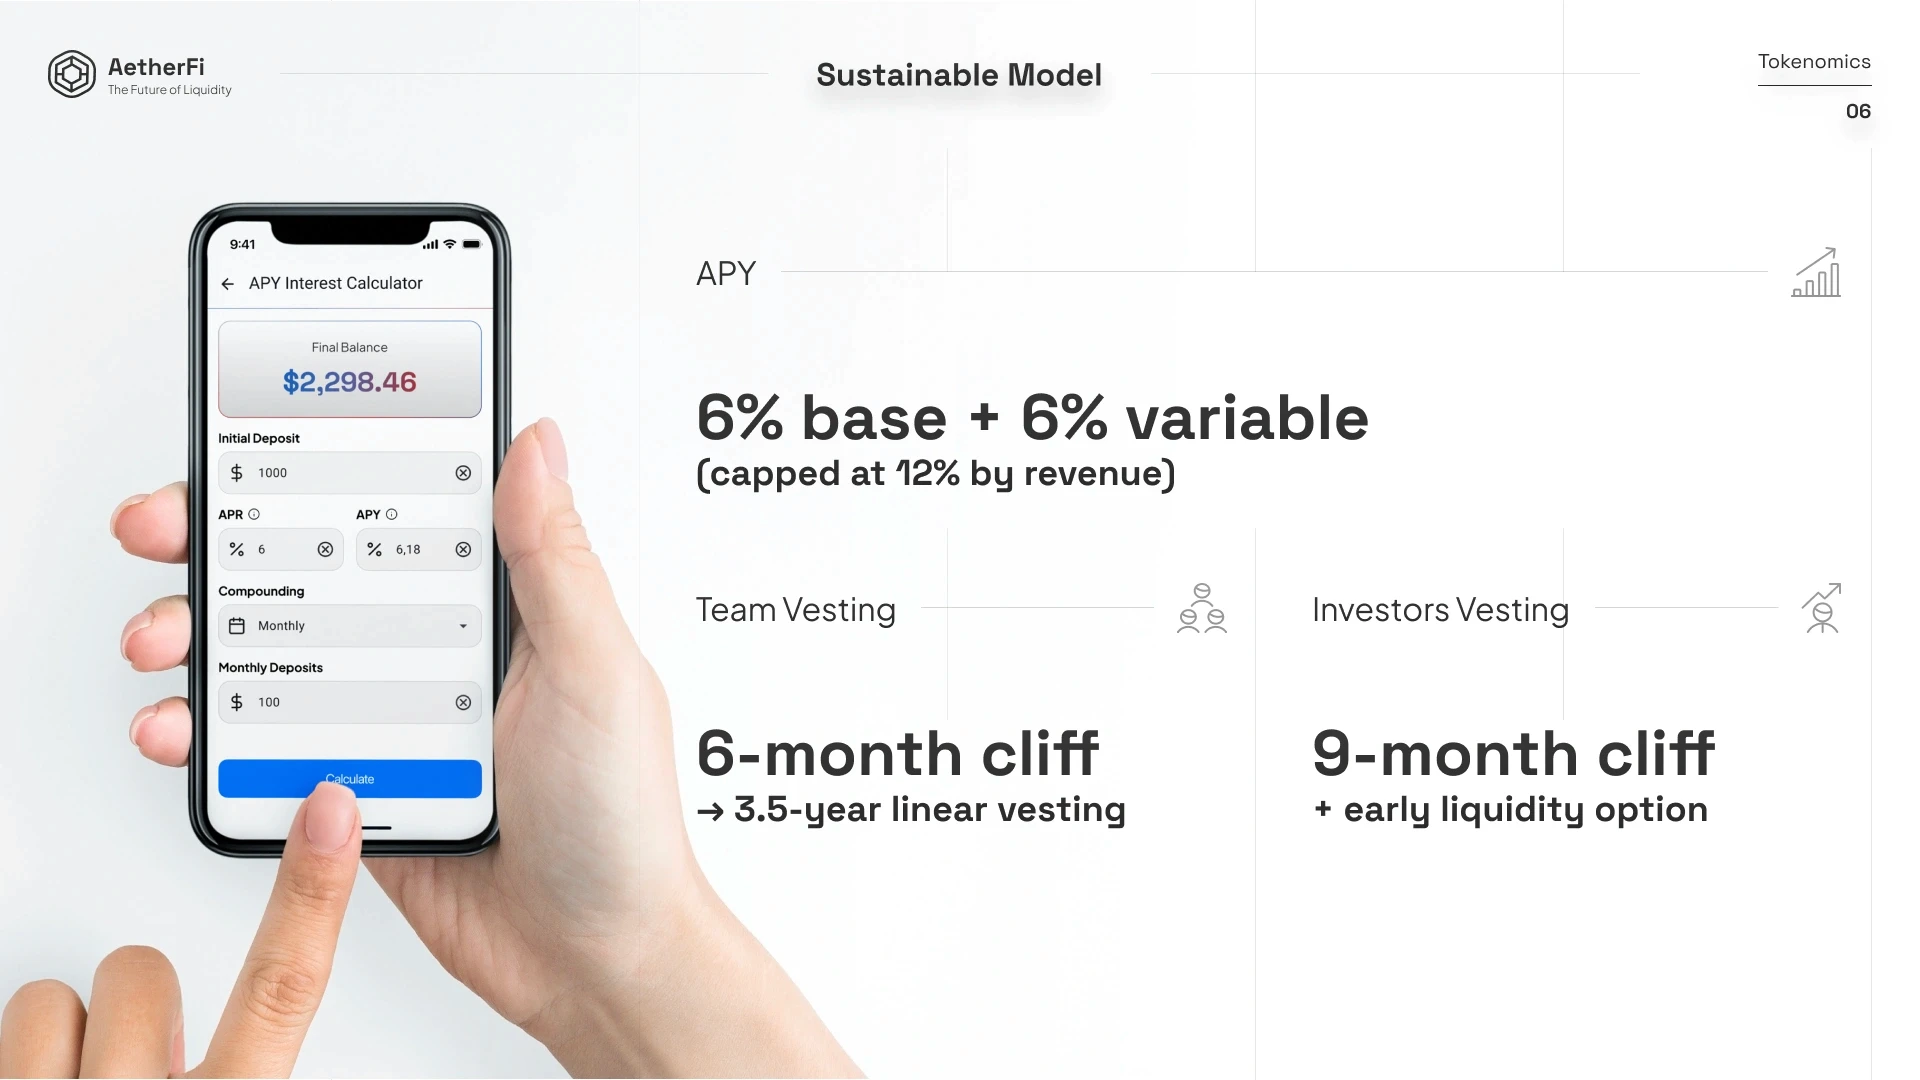
AetherFi token yield, team vesting, and investor vesting model.
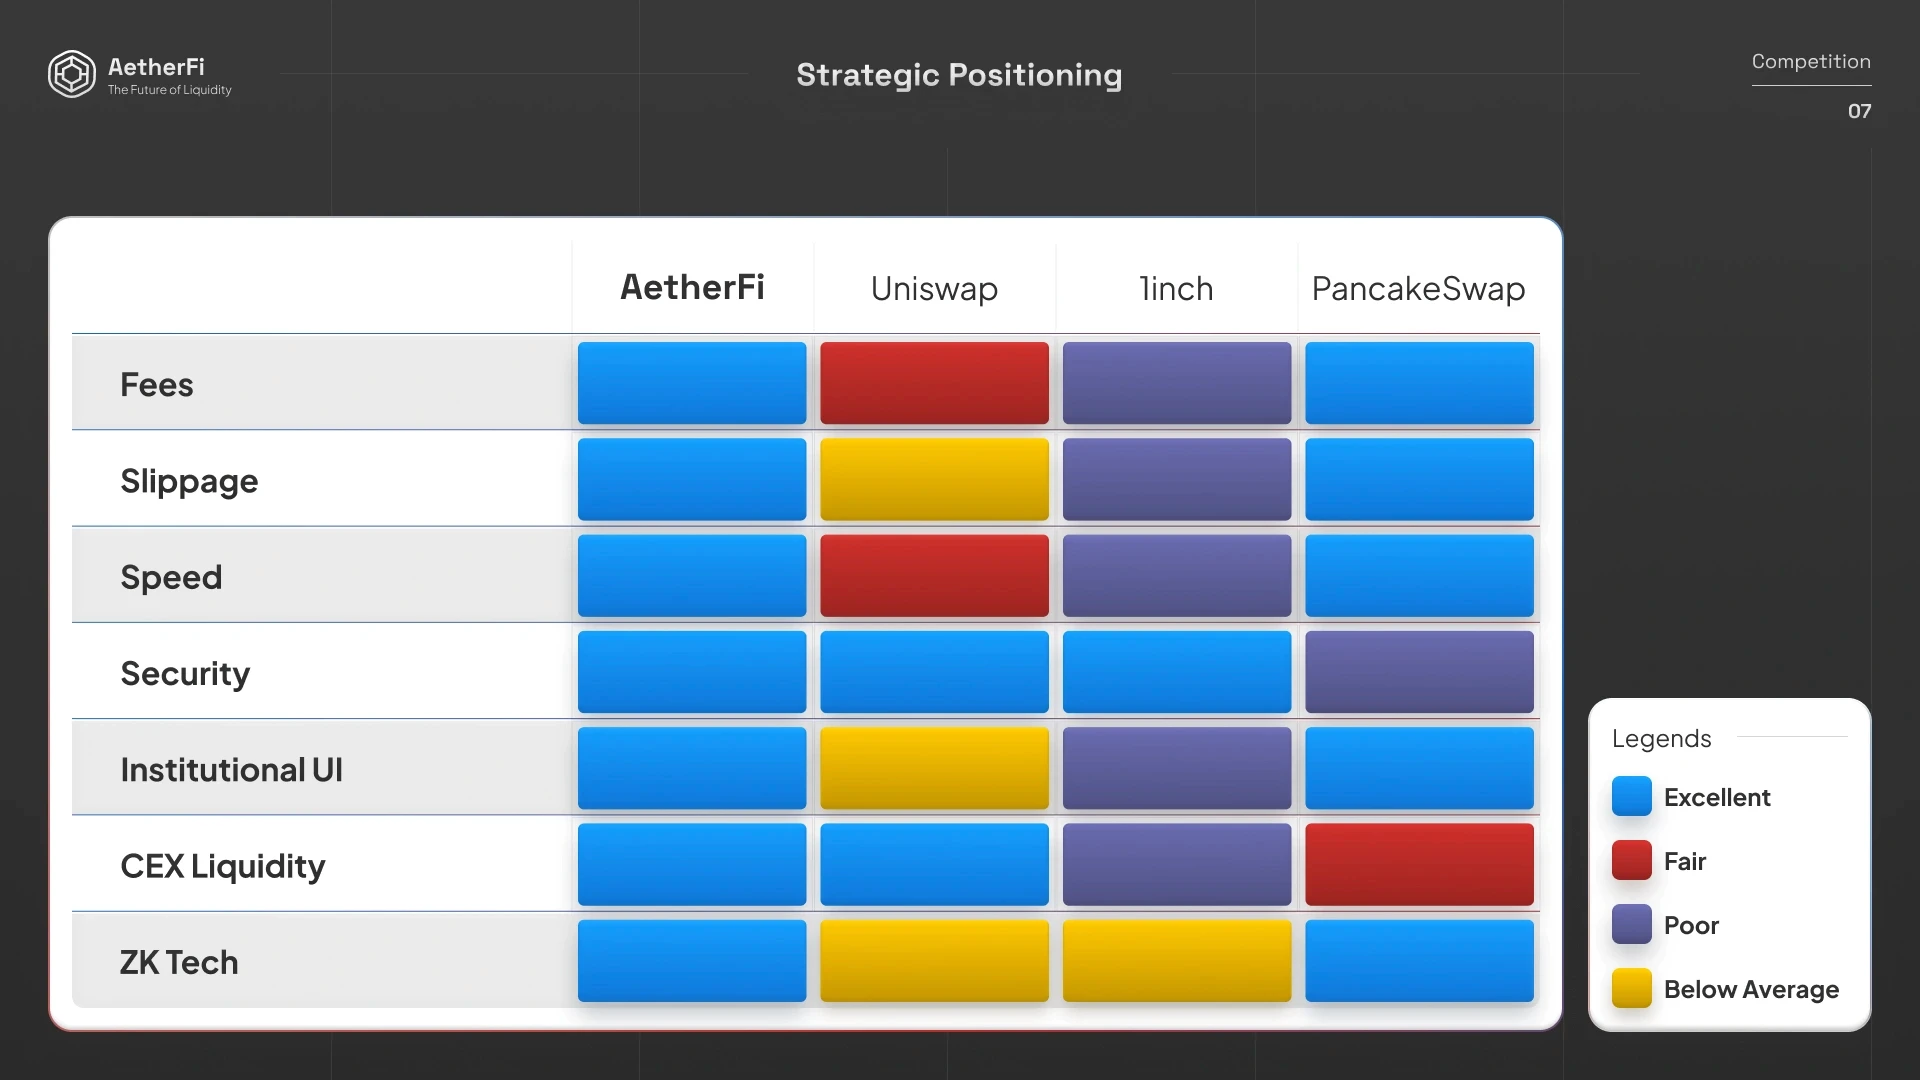
AetherFi competitor matrix comparing fees, slippage, speed, security, and liquidity.
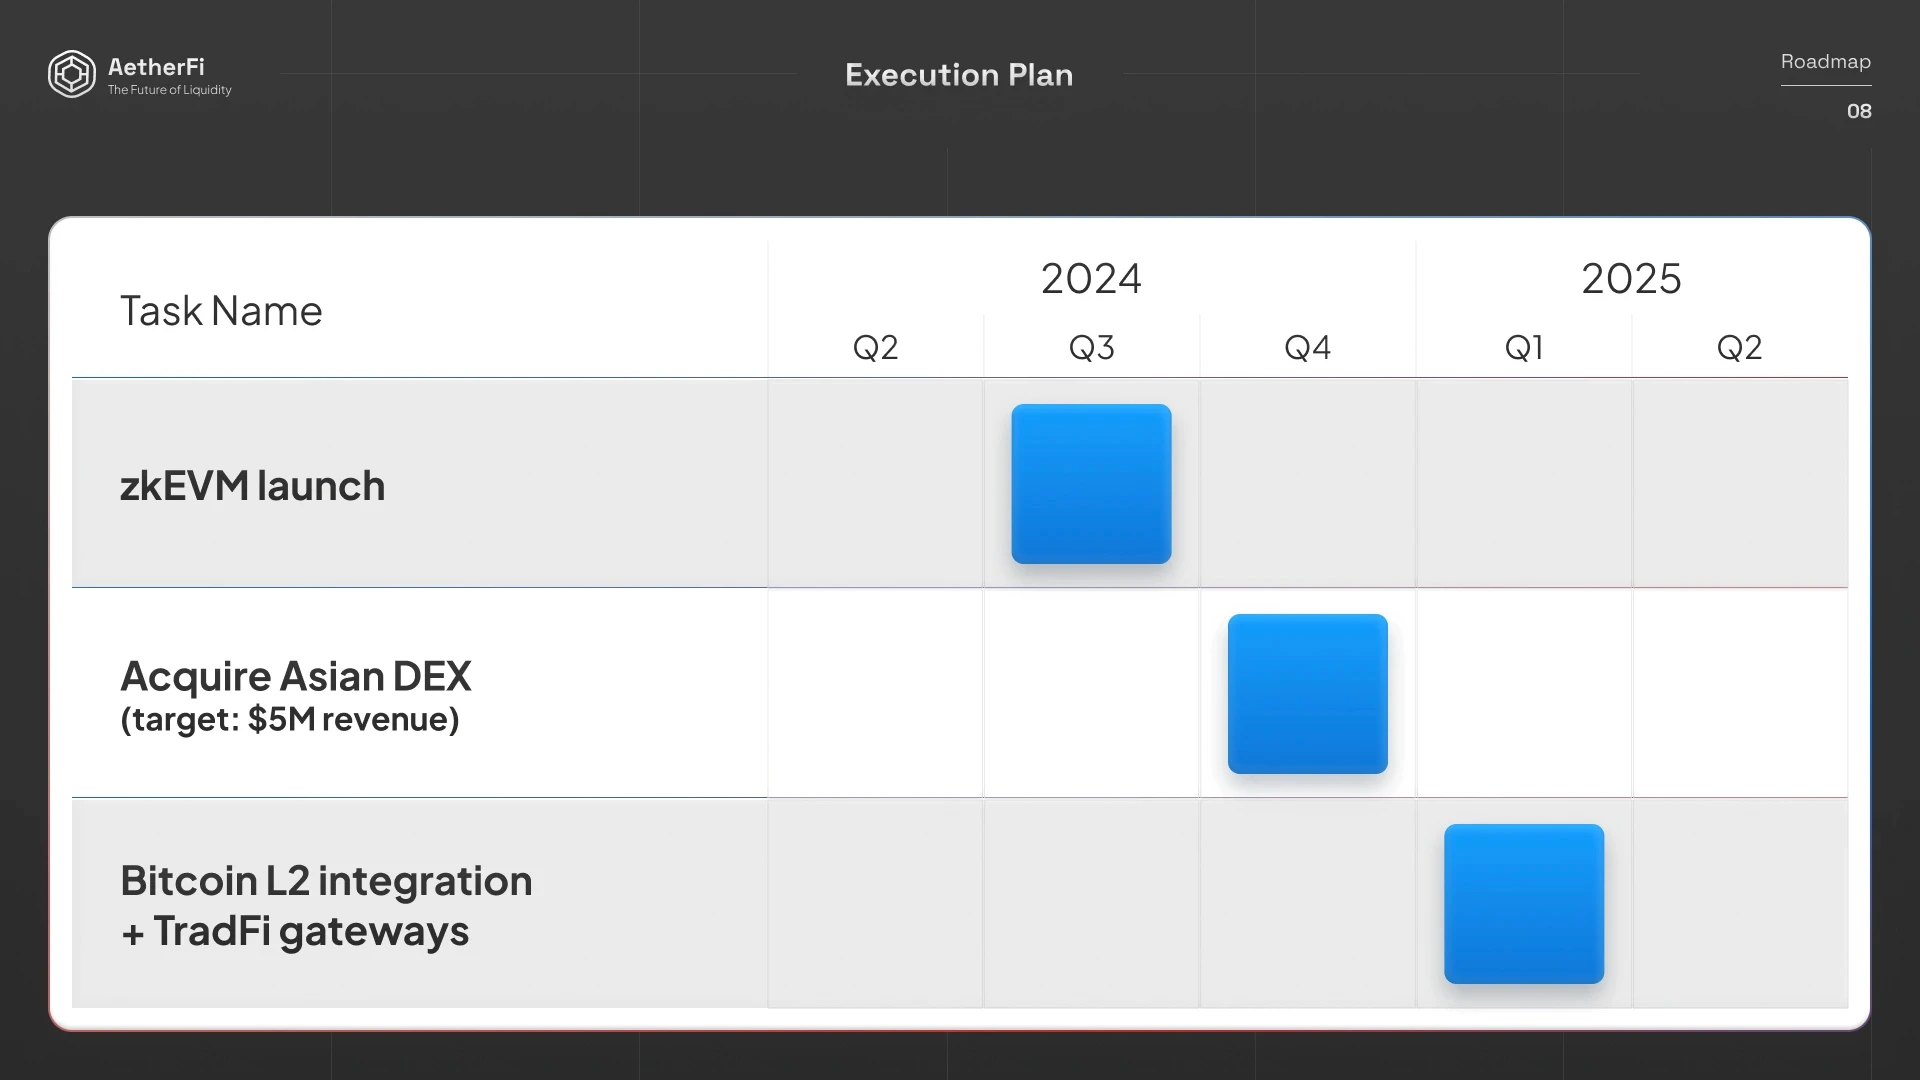
AetherFi execution roadmap for product releases, integrations, and market expansion.
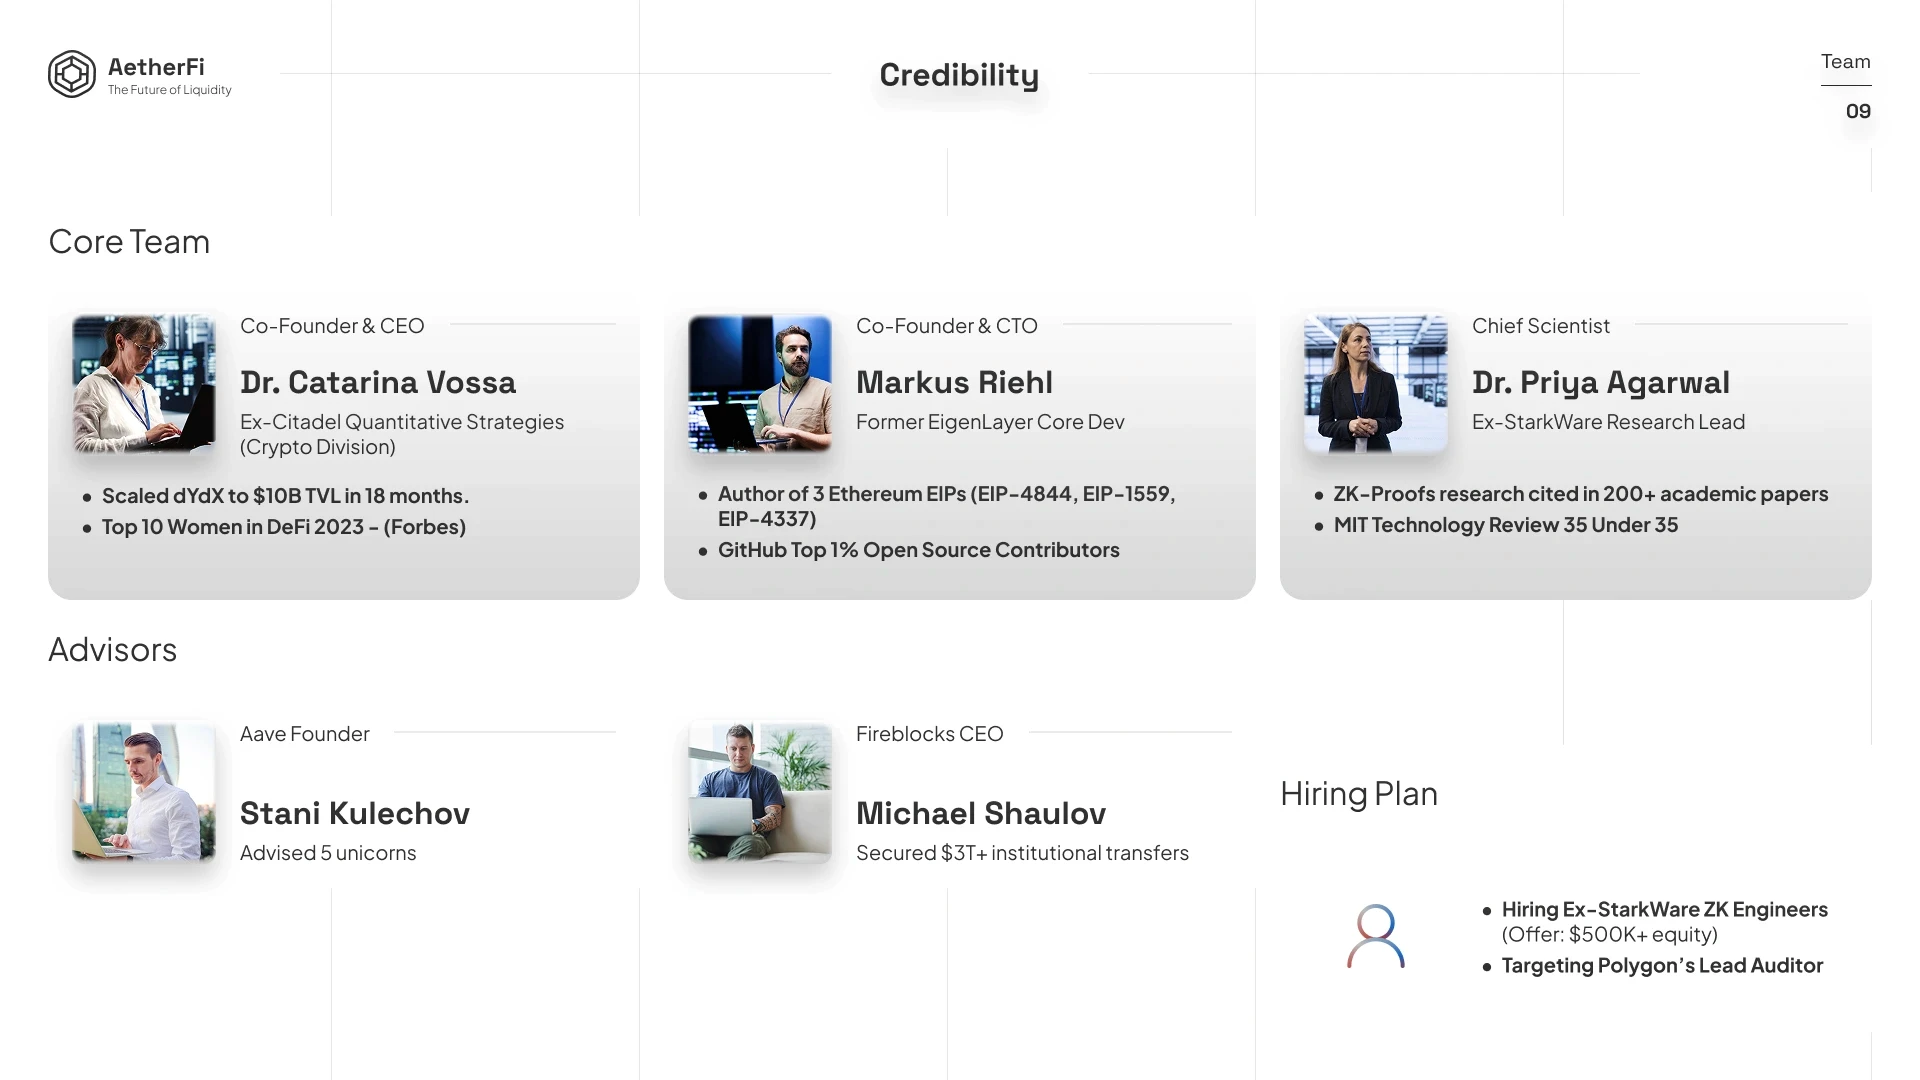
AetherFi team, advisory profiles, and planned technical hiring.
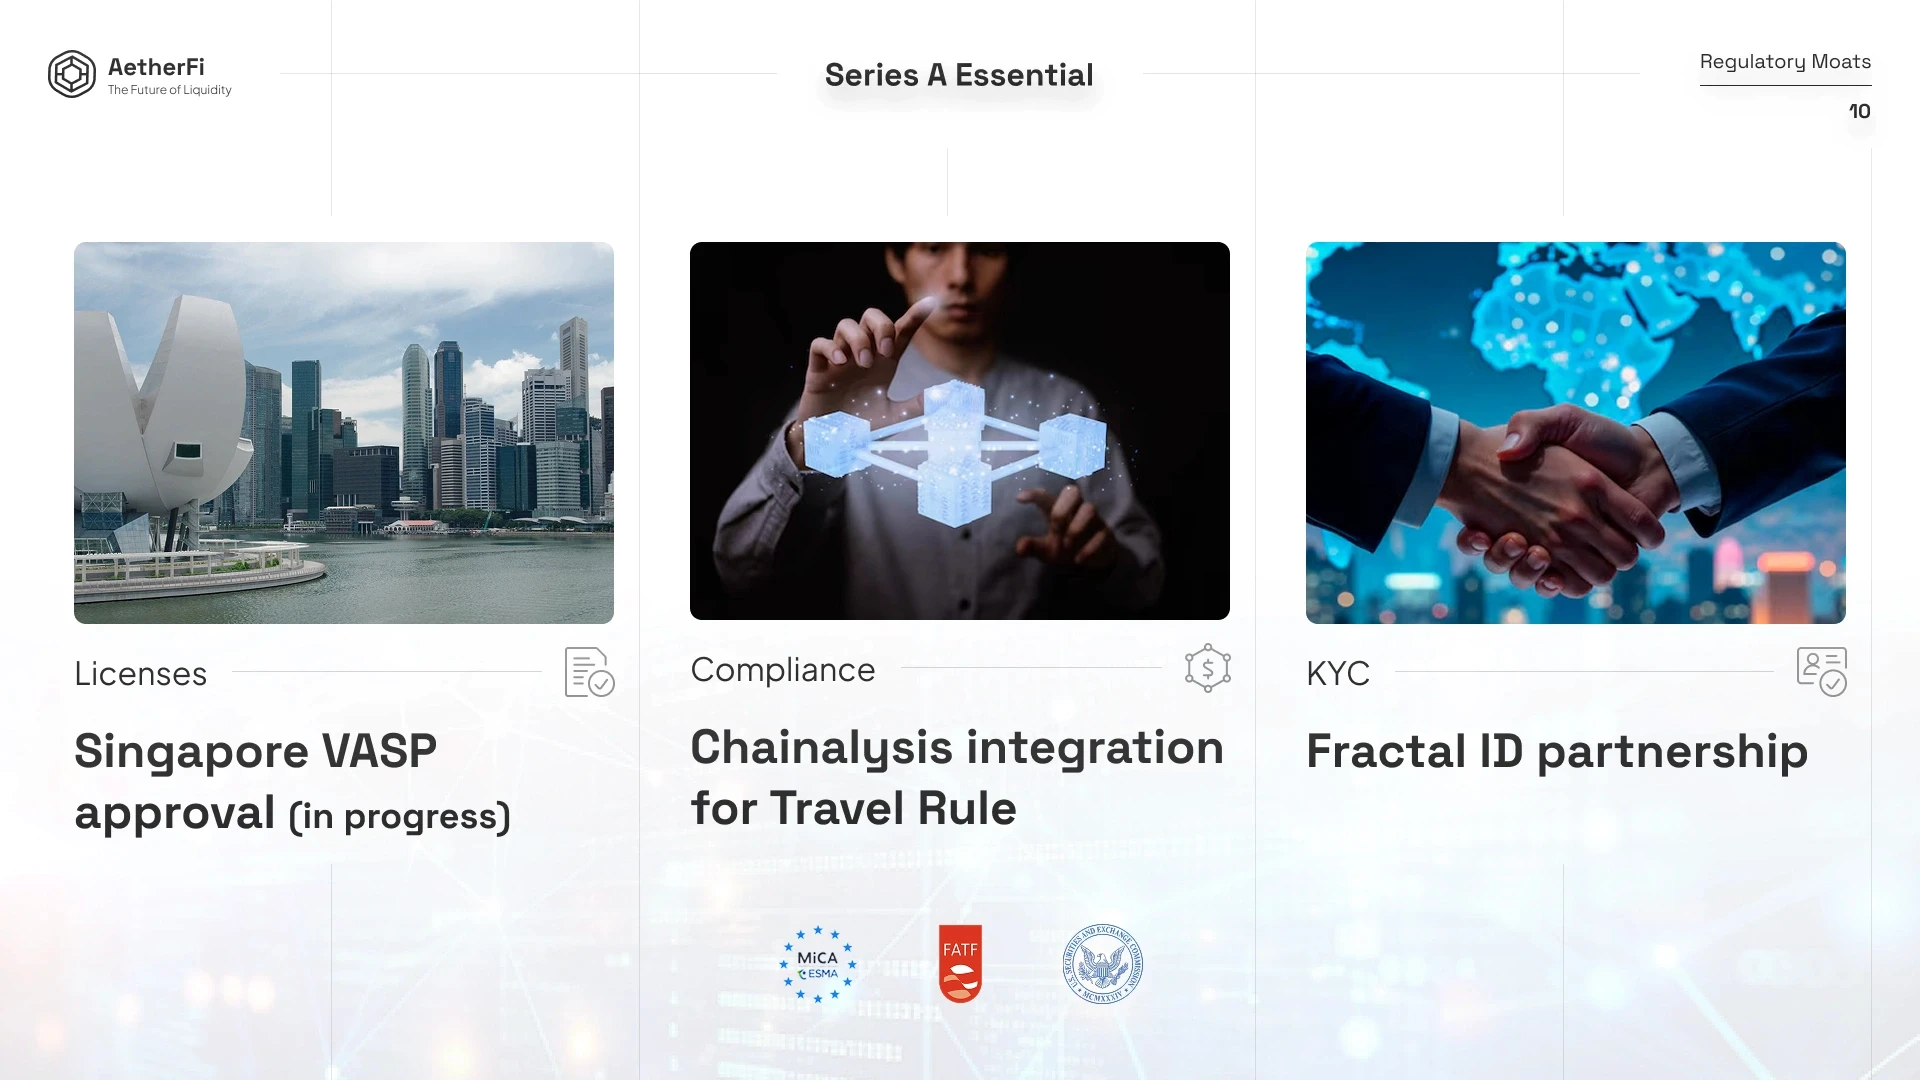
AetherFi licensing plans, transaction compliance integration, and identity verification partnerships.
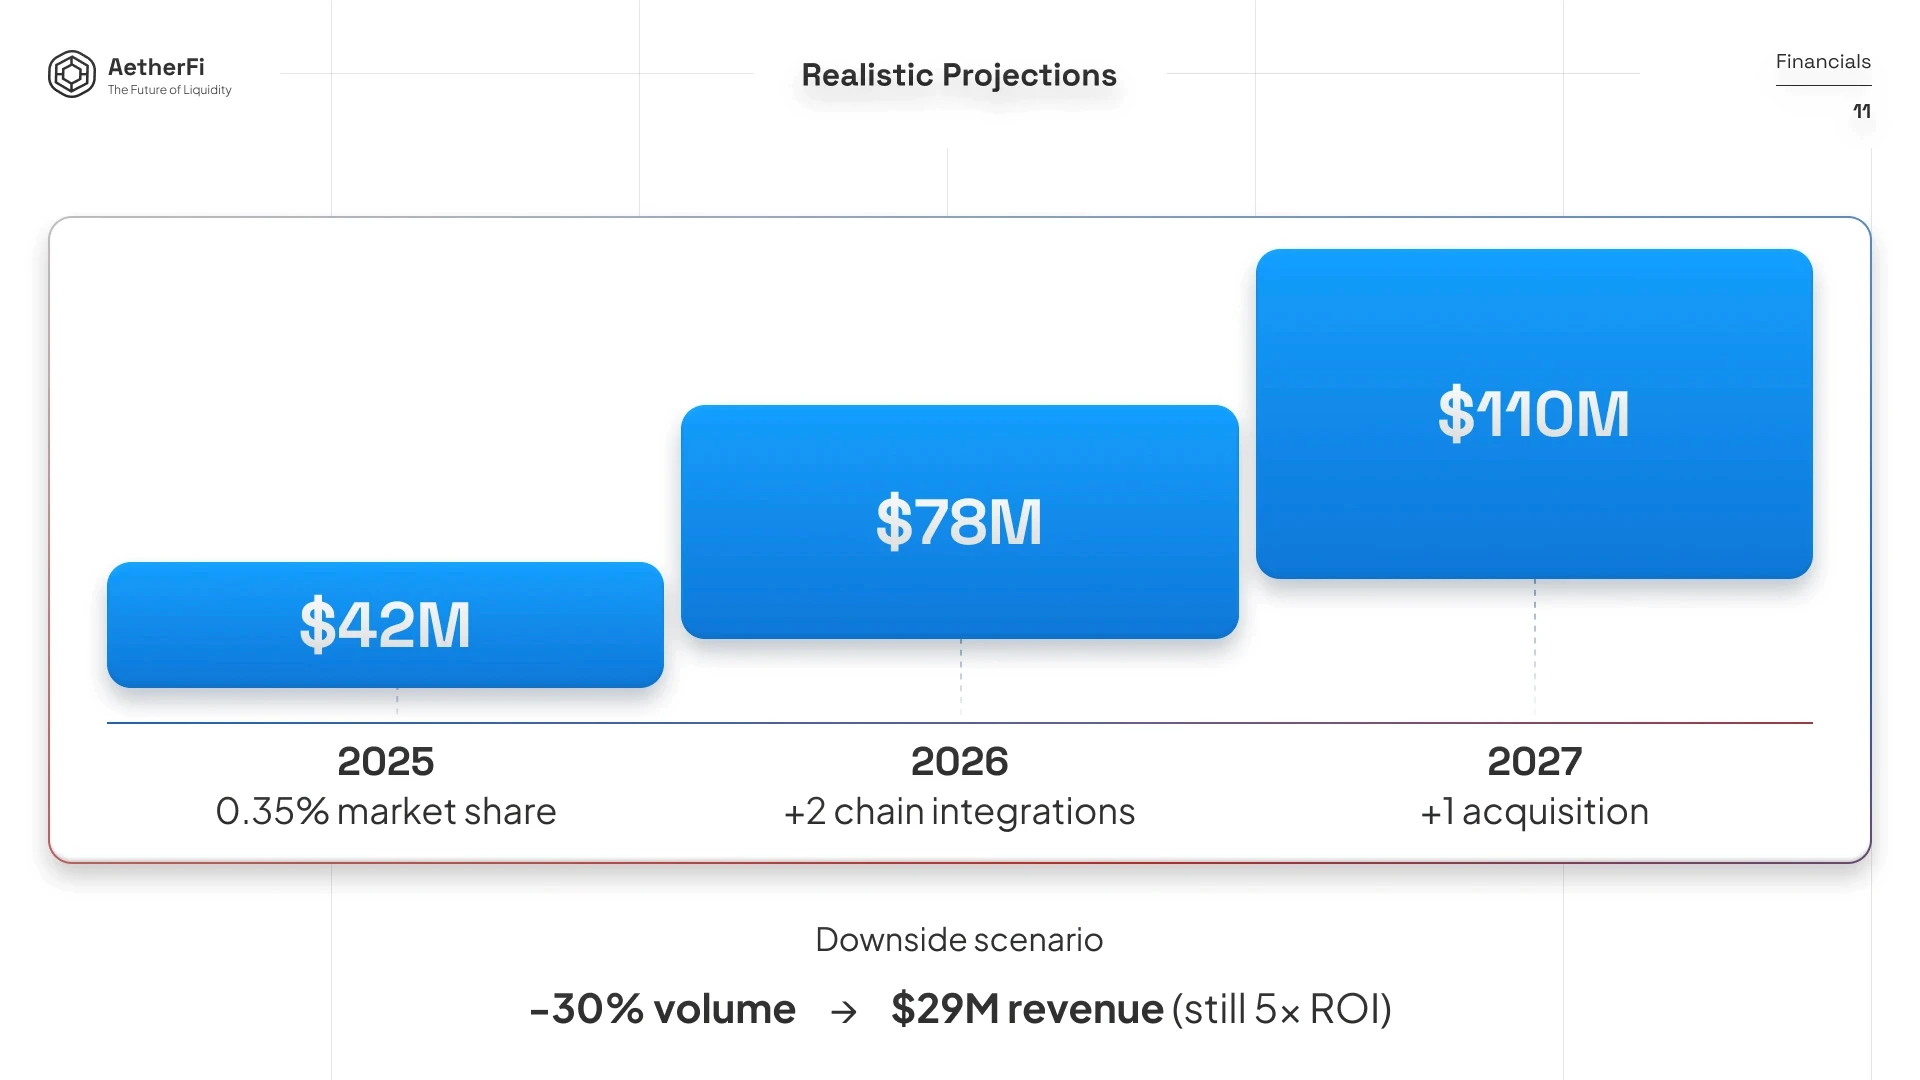
AetherFi financial projections and a downside revenue scenario.
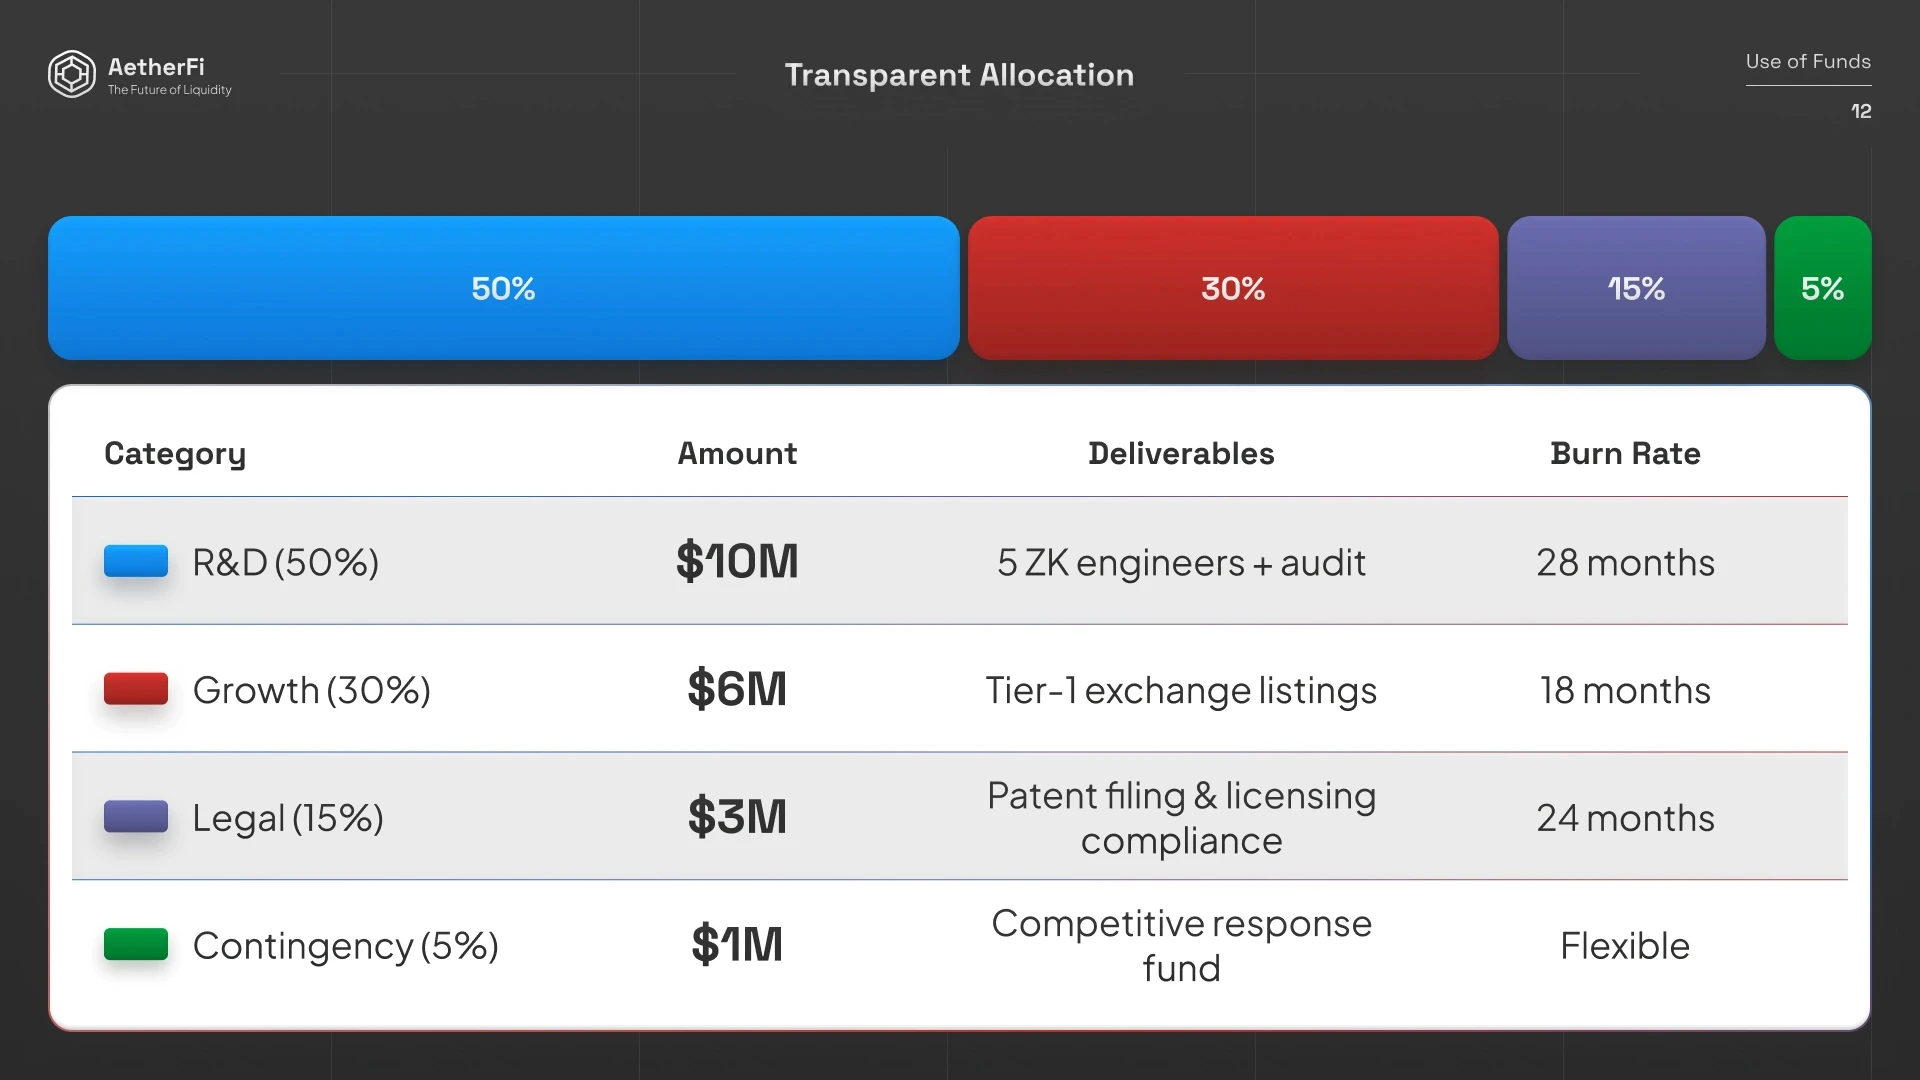
AetherFi proposed funding allocation with deliverables and runway by category.
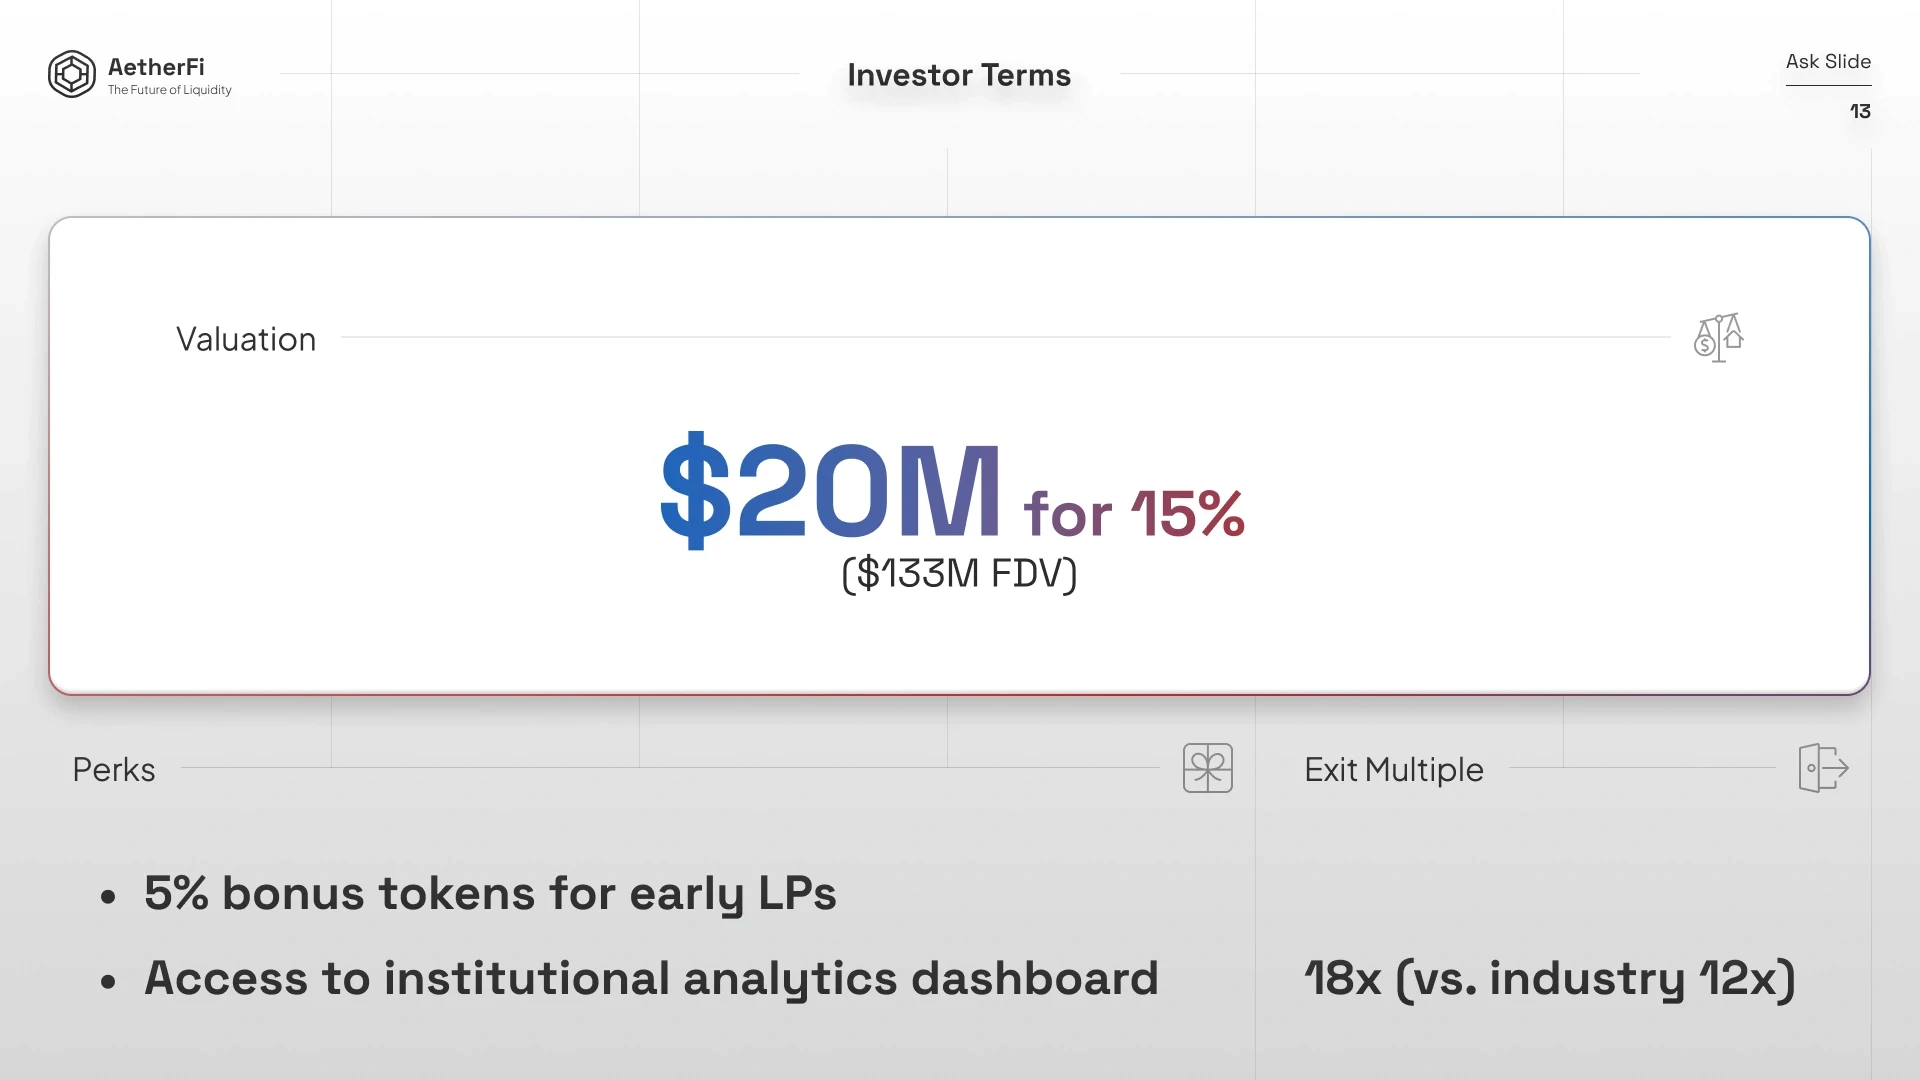
AetherFi proposed investment terms, valuation, and investor participation benefits.
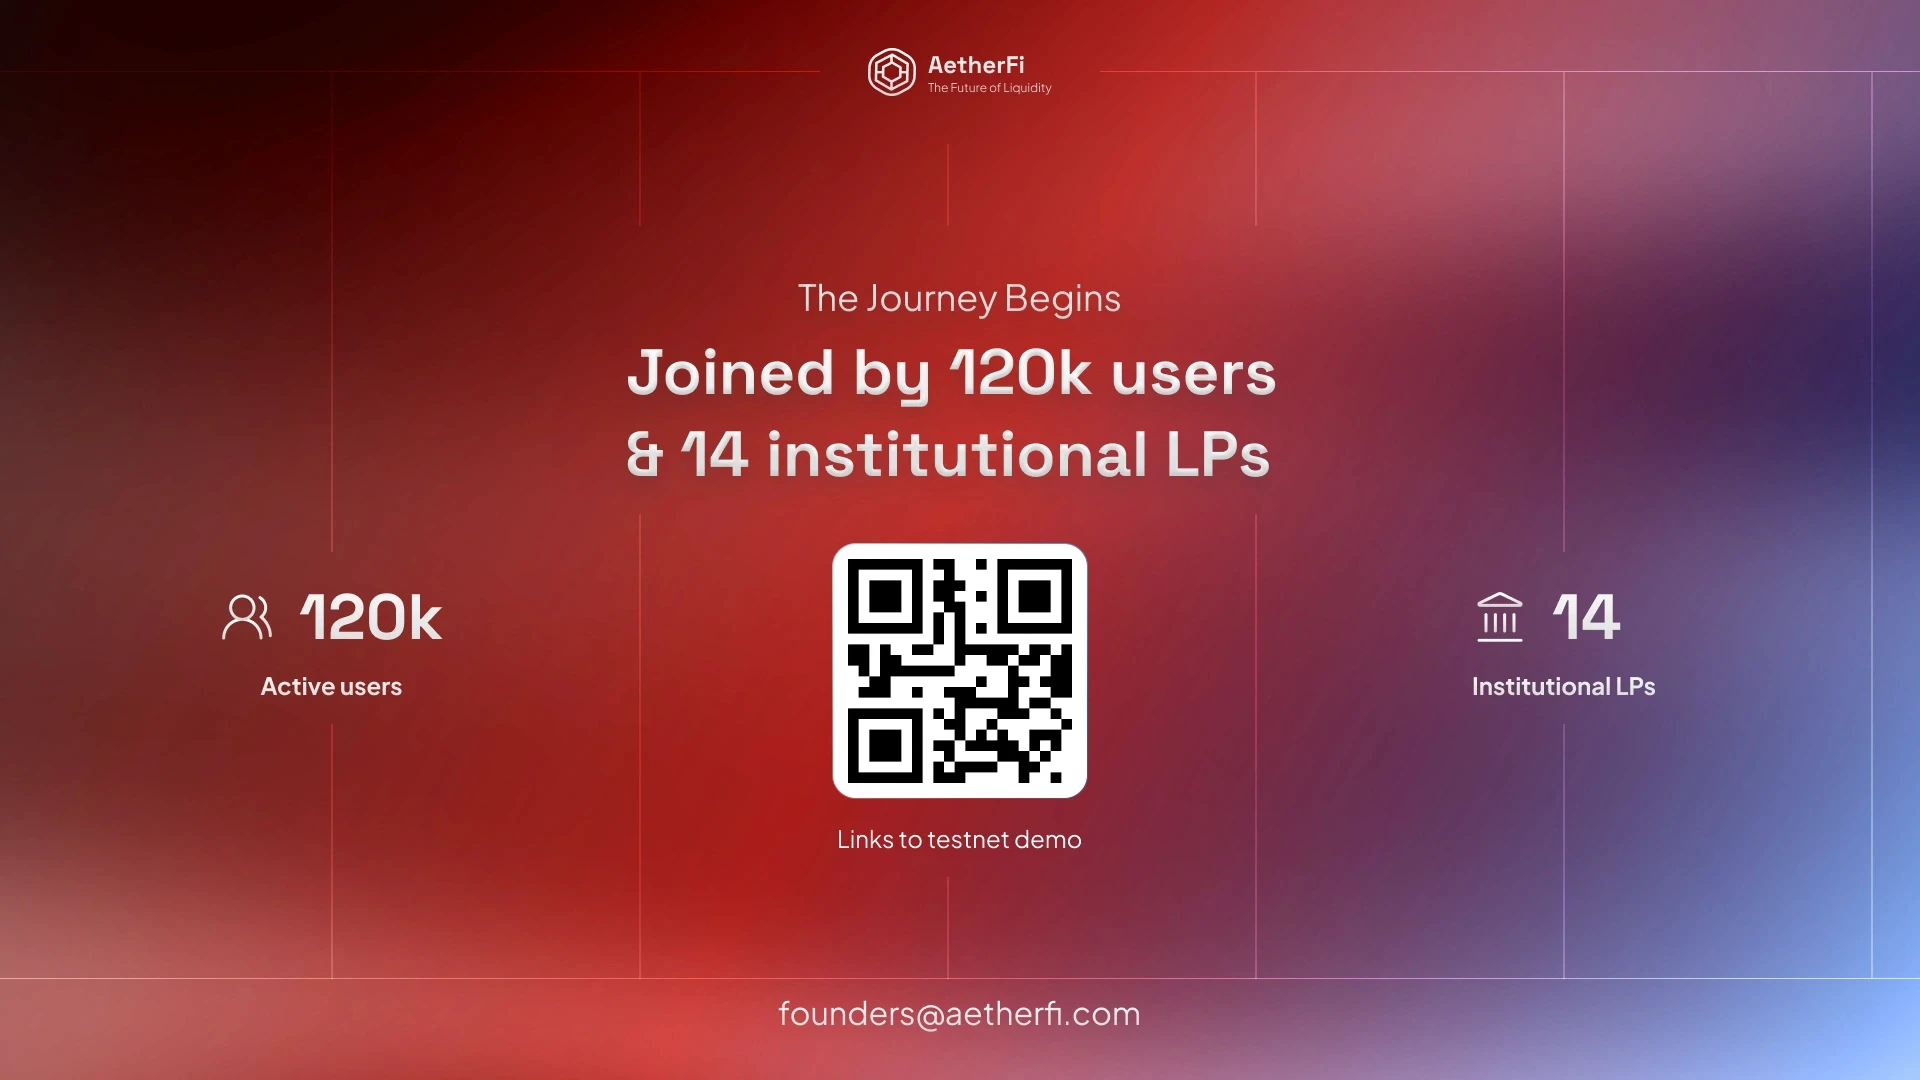
AetherFi closing page presenting user adoption, institutional liquidity partners, and a demo link.

The Challenge

The deck needed to make infrastructure problems tangible for investors without becoming a technical whitepaper. Transaction failures, gas costs, and slippage required a clear explanation before introducing the proposed solution and business model.

Design Deliverable

I opened with a failed-versus-successful swap comparison, then introduced the product through a mechanism slide and network imagery. Dark gradient covers frame light analytical pages, with blue accents organizing charts, tables, and timelines. A benchmark table separates validation metrics from comparison data. A competitive matrix, vesting diagram, and execution roadmap give different questions distinct visual structures. The closing financial sequence connects the projection scenario, capital allocation, and proposed terms.